 NIWA - Metadata Catalogue
Keyword
sediment analysis
4 record(s)
Type of resources
Topics
Keywords
Contact for the resource
Provided by
Years
Representation types
Status
-
NIWA surface sediment data from the NZOI A-Y stations that have been standardised to the dbseabed format. NIWA samples have been processed and QC'd by INSTAAR University of Colorado, Boulder. dbSEABED creates unified, detailed mappings of the materials that make the seafloor by efficiently integrating thousands of individual datasets. The goal is to bring decades of seabed information - and today's information - from marine geology, biology, engineering and surveys into one seabed mapping that can fulfil the community needs for ocean-bottom information on many spatial scales. The system deals with seabed texture, composition, acoustic properties, colour, geology and biology. Quality assurance is achieved by checks on data at data entry, by error-trapping in the data-processing software, and by working the data intensively in various collaborative research programs. dbSEABED was devised to be robust in an inexact and incomplete information environment - marine geosciences. There are two versions of the data available: (1) the archives data, which are available as MS Excel spreadsheets - one for each letter of the A-Z station registers; (2) NIWA nzSeabed standard data, which is the same standard afters being standardised by dbSeabed and are available as ASCII text files. The data are available at either Q:\Ocean_Geology\Sediment%20samples/ or file://niwa.local/groups/wellington/Ocean_Geology/Sediment%20samples/
-

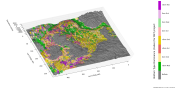
This is a ESRI binary raster grid showing the percentage gravel component of the seafloor substrate. The raster (otago_gvl) is in an equal area projection at a 500m resolution. Historical point-source data from NIWA’s digital sediments archive provided information on the relative composition of surficial sediments in the region of interest, based on the broad grain-size classifications: % gravel (>2 mm diameter), % sand (0.063 to 2 mm) and % mud (<0.063 mm), based on the Wentworth grade scale. Information on the presence of rocks at certain locations was also provided from the NIWA archives. Gravel corresponds to particles that are 2-75 mm in diameter (with cobbles and boulders greater than 75 mm), sand 0.07-2 mm and mud less than 0.07 mm. The bathymetry and sediment/substrate information were combined using the dbSEABED software system, and the outputs then used to derive the best-fit models of geomorphic and reef features on the continental shelf in the Otago-Southland-Rakiura/Stewart Island region. This project merged point-source substrate and gridded bathymetric data from NIWA, as well as additional data-sets from other publications and sources; specifically LINZ data on hydrographic obstructions and the DoC subtidal reef distribution map product, which were all incorporated into the dbSEABED analysis. The NIWA data-sets were delivered, ingested into dbSEABED using software methods, and tested for data consistency and completeness. Mapped distributions of the rocky coastline and ‘reefs awash’ were invaluable for delineation of ecologically important rock substrates at the seabed, although it should be recognised that these data are modelled outputs and perhaps biased by the spatial distribution and quality of input parameters, such as surficial sediment grain-size characteristics (i.e., % gravel, % sand, % mud). The data were integrated spatially in dbSEABED over 7714 sample locations derived from 22 distinct data-sets. Only samples in the top 0.3 m (1 foot) were used for the surficial seabed mapping, since this depth was deemed to be appropriate for accounting for variations in physical seabed conditions and processes, such as erosion and deposition episodes, bedform development and bioturbation. The mapping was time-averaged over several decades. Modelled seabed observations were made for numerous parameters, such as sediment texture, sediment mass strength, colour, composition, rock exposure, grain-clast types and biology. A primary operation in dbSEABED is to integrate these observations so they can be presented as a small number of parameters with useful amounts of data per map while managing the uncertainties. From previous experience, the ‘top-20’ parameters (see Buczkowski et al. (2006)) indicate that grain-size and sorting (phi), gravel/sand/mud contents (%), rock exposure (%), and carbonate content (%) are among the most useful characteristics to model and gridded maps were prepared for these parameters for the Otago shelf region. Unfortunately, no data on organic carbon contents (%) were available to map. The gridding method used a refined Inverse Distance Weighting (IDW) method – the “Competent Seabed Interpolator” – where cells with values are assigned the median value of that data, and then weightings are applied based on XY distance and water depth difference. The outputs are provided as ESRI ASCII grids that can be imported into GIS and displayed with standardised INSTAAR-USGS legends (Jenkins, 2014) for consistent communication of the mapping results. Full details of the gridding methods used in dbSEABED are given in the cited report (Nodder et al. 2014). Data on project O drive: O:\DOC15302\Working\Digital data delivery\Substrate\Sediment grids\Otago_gvl
-
NIWA (and its predecessor NZOI) have been collecting and analysing sediment from the seafloor around New Zealand and the South Pacific since the late 1950s and the details of these are stored in a database. This database contains station details (such as station id, position, and date) and the sediment analysis (grainsize analysis: % sand, % mud, % carbonate).
-
Plant and Food Research engaged NIWA to design and implement a survey programme to monitor the effects of an experimental fish feeding operation on the benthic environment in Nelson Haven, to satisfy resource consent requirements. This was conducted to assess whether the feeding programme would adversely affect the local benthic environment, the survey focussed on measuring key indicators of organic enrichment. To do this, a range of sediment physicochemical parameters were characterised using benthic cores and sledding methods. Parameters included: sediment grain size, sediment organic content, sediment colour and smell, and redox potential of surficial sediment,and also biotic features including: the composition of animal communities living upon and within the sediments, and the distribution and abundance of macroalgae. This report describes the survey undertaken 8 months after the commencement of the fish feeding activity. Benthic and sediment data from 7 sites have been processed, checked, analysed, and summarised in the client report. Previous reports in this time series are: Brown, S. N. (2014a). Wildfish 2030: Benthic Monitoring Baseline Survey. Report prepared for Plant and Food Research Ltd. NIWA Client Report No. NEL2014-013. 18 p. Brown, S. N. (2014b). Wildfish 2030: Benthic Monitoring Survey – First post baseline survey. Report prepared for Plant and Food Research Ltd. NIWA Client Report No. NEL2014-021.18 p.