 NIWA - Metadata Catalogue
Contact for the resource
NIWA National Institute of Water and Atmospheric Research Ltd
2 record(s)
Type of resources
Topics
Keywords
Contact for the resource
Provided by
Years
Formats
Representation types
Status
-
The National Institute of Water and Atmospheric Research (NIWA) operates a DAS on a number of vessels, both those operated by NIWA, and other vessels of opportunity. The data collected by the DAS varies considerably, but typically includes vessel geographic position, meteorological information, vessel heading and speed, water property measurements, locations of deployed instruments, depth of the water beneath the vessel, etc. These data can be stored by a DAS in a variety of formats, ranging from simple ASCII files through to self-describing binary formats such as NetCDF. The interval between measurements from the various instruments can vary from 0.1 seconds to hours. In general, a DAS stores low volume, regularly sampled data rather than data from high volume, high rate instruments. The extent of data collection includes waters within the New Zealand 200 n. mile Exclusive Economic Zone (EEZ), the Tasman Sea, waters from New Zealand across to South America, and Antarctic waters.
-
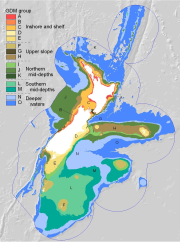
Distributional data for eight taxonomic groups (asteroids, bryozoans, benthic foraminiferans, octocorals, polychaetes, matrix-forming scleractinian corals, sponges, and benthic fish) have been used to train an environmental classification for those parts of New Zealand's 200 n. mile Exclusive Economic Zone (EEZ) with depths of 3000 m or less. A variety of environmental variables were used as input to this process, including estimates of depth, temperature, salinity, sea surface temperature gradient, surface water productivity, suspended sediments, tidal currents, and seafloor sediments and slope. These variables were transformed using results averaged across eight Generalised Dissimilarity Modelling analyses that indicate relationships between species turnover and environment for each species group. The matrix of transformed variables was then classified using k-medoids clustering to identify an initial set of 300 groups, with relationships between these groups then described using agglomerative hierarchical clustering. Groups at a fifteen group level of classification appropriate for use at a whole-of-EEZ scale are described; the classification can also be used at other levels of detail, for example when higher levels of classification detail are required to discriminate variation within study areas of more limited extent. Although not formally tested in this analysis, we expect the analytical process used here to increase the biological discrimination of the environmental classification. That is, the resulting environmental groups are more likely to have similar biological characteristics than when the input environmental variables are selected, weighted, and perhaps transformed using qualitative methods. The input environmental data were on a 1 km x1 km grid and the 15-group classification output exists as an ESRI shapefile.